I live near the very beautiful, but polluted Onondaga Lake. That I knew, but I found out many other environmental concerns in my area by using mapping data on NEPAssist, from the Environmental Protection Agency.
The always-helpful Society of Environmental Journalists tipped me off to this new online resource in a post earlier this month called “cool data tools.” As SEJ notes, “A new data tool can help reporters and public find and visualize the important issues that come along with sometimes-obscure environmental impact reviews.”
The National Environmental Policy Act (NEPA) requires that the federal government show how its decisions might affect the environment. Many years-worth of these impact statements (EISs) exist. This new tool helps you get a visual assessment of them, and allows layering of data, including demographic information.
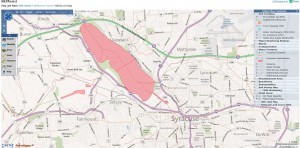
The visual here shows the map of Onondaga Lake, in my home area, after I clicked in NEPAssist for “impaired waterbodies.” The code at the right told me that pink represented those waterways of concern. You can also ask the program to show you toxic releases, soil surveys, flood plains and more.
I strongly recommend you carefully read through the help guide, which helped speed my learning of how to create and interpret the map.
This visual data could help point you to new stories or be a reminder to check on ongoing concerns. Let me know other online resources that help you in discovering stories.
