![]() If you are looking for some research about mobile and media, check out Google’s new databoard. It currently offers research on how consumers:
If you are looking for some research about mobile and media, check out Google’s new databoard. It currently offers research on how consumers:
- search with a mobile device
- navigate multiple screens
- shop in stores with a smartphone, and
- use online video.
You get summary info in well-designed graphics but can click in and get more of the data and the report.
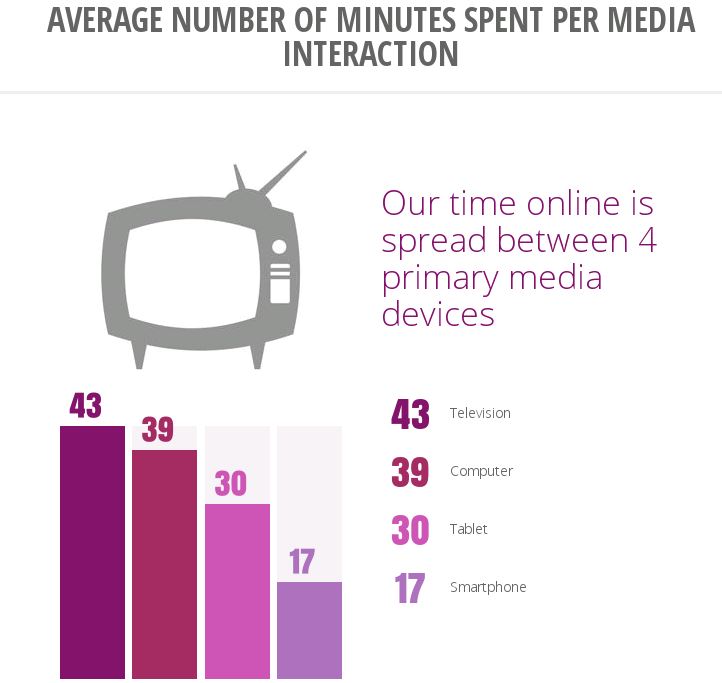
But the best feature is you can combine the stats and graphics together into a customized infographic such as this:
These infographics are automatically designed in blocks and you can easily put them together with a few clicks. Then you just click the “publish” button and post on . Google+, twitter or facebook. Or email it to yourself or someone. Or you can get a custom URL.
To learn more, view this video that explains how it works.